| MKTX Trades at New Highs  Dear Chart Of The Day Reader, Dear Chart Of The Day Reader,
Yesterday, we looked at daily price chart and an OBV line chart for Yeti Holdings, Inc. noting that the stock’s OBV line was trending up. Today’s Chart of the Day is a Daily Price Chart for MarketAxess Holdings Inc. (NASDAQ: MKTX). MarketAxess Holdings Inc., together with its subsidiaries, operates an electronic trading platform that enables fixed-income market participants to trade corporate bonds and other types of fixed-income instruments worldwide. It offers institutional investor and broker-dealer firms the access to global liquidity in U.S. investment-grade corporate bonds, emerging markets and high-yield bonds, Eurobonds, U.S. agency bonds, municipal bonds, leveraged loans, and other fixed-income securities. Now, below is a Daily Price Chart with the 50-Day EMA and 100-Day EMA for MarketAxess Holdings Inc. Back on April 13, the MKTX 50-Day EMA (blue line) crossed above the 100-Day EMA (red line) indicating MKTX was showing a ‘buy’ signal (circled). 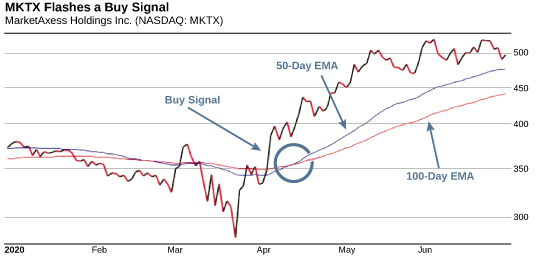 When the 50-Day Exponential Moving Average crosses above the 100-Day Exponential Moving Average, this indicates that the stock’s buying pressure has begun to outweigh the selling pressure signaling a ‘buy’ signal. When the 50-Day EMA crosses below the 100-Day EMA this indicates that the selling pressure has begun to outweigh the buying pressure, signaling a ‘sell’ signal. To sum this up: - 50-Day EMA line above 100-Day EMA = Buy signal
- 50 Day EMA line below 100-Day EMA = Sell signal
If you had purchased MKTX shares when the 50-Day EMA crossed above the 100-Day EMA on April 13, when the stock was around $385.79, you’d be up 28.9% by now. Not a bad profit for a just over a two month hold of a large trading company. Now, as you can see, the 50-Day EMA is still above the 100-Day EMA. That means the bullish trend is still in play! As long as the 50-Day EMA remains above the 100-Day EMA, the stock is more likely to keep trading at new highs in the coming days and weeks. We’ll be keeping our eye on this stock as it continues to trend upward. Best Regards, 
Chuck Hughes
Editor, Chart Of The Day | 


没有评论:
发表评论