| BioTech Co. Trends Bullish  Dear Chart Of The Day Reader, Dear Chart Of The Day Reader,
Yesterday, we looked at a Daily Price Chart with the 50–Day EMA and 100–Day EMA for Equinix, Inc. noting that the stock's 50–Day EMA was above the 100–Day EMA. Today's Chart of the Day is a Daily Price Chart with moving averages for Novavax, Inc. (NYSE: NVAX). Novavax, Inc., together with its subsidiary, Novavax AB, a late–stage biotechnology company, focuses on the discovery, development, and commercialization of vaccines to prevent serious infectious diseases. The company's lead vaccine candidates include ResVax, a respiratory syncytial virus (RSV) fusion (F) protein nanoparticle vaccine candidate that in Phase III clinical trial to protect infants from RSV disease through maternal immunization. Now, below is a Daily Price Chart with moving averages for Novavax, Inc. Back in January, the NVAX 1–Month price crossed above the 10–Month simple moving–average (SMA) indicating NVAX is on a PowerTrend 'Buy' signal (circled). 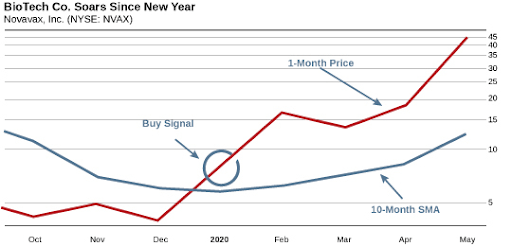 And since then, the price has continued to rise, never dipping back to the 10–Month SMA. Since the PowerTrend 'Buy' signal occurred for the stock back in January, when the stock was around $7.62, the stock has seen an 488.5% increase. Now, as you can see, the 1–Month moving–average is still above the 10–Bonth SMA. That means the bullish trend is still in play! This bullish price trend makes NVAX a good candidate for a call option purchase. As long as the 1–Month price remains above the 10–month SMA, the stock is more likely to keep trading at new highs in the coming days and weeks. We'll be keeping our eye on this stock as it continues to trend upward so we'll know the moment the market conditions shift and the stock begins to come back down offering a better buying opportunity in a bullish market. Best Regards, 
Chuck Hughes
Editor, Chart Of The Day | 


没有评论:
发表评论