| Tesla Still in Bullish Trend  Dear Chart Of The Day Reader, Dear Chart Of The Day Reader,
Yesterday, we looked at a Daily Price Chart with a MACD Chart for Sea Ltd., noting that the stock's MACD line was showing a 'buy' signal. Today's Chart of the Day is a Daily Price Chart with EMAs for Tesla Inc. (NYSE: TSLA). Tesla, Inc. designs, develops, manufactures, leases, and sells electric vehicles, and energy generation and storage systems in the United States, China, Netherlands, Norway, and internationally. The company operates in two segments, Automotive; and Energy Generation and Storage. Now, below is a Daily Price Chart with the 50–Day EMA and 100–Day EMA for Tesla Inc. Back on October 21st, the TSLA 50–Day Exponential Moving Average (blue line) crossed above the 100–Day Exponential Moving Average (red line), indicating TSLA was showing a 'buy' signal (circled). 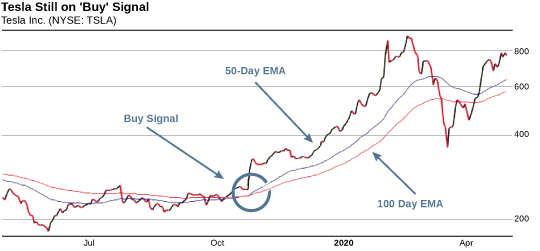 When the 50–Day EMA crosses above the 100–Day EMA, the stock's buying pressure has begun to outweigh the selling pressure. This is a 'buy' signal. When the 50–Day EMA crosses below the 100–Day EMA, the stock's selling pressure has begun to outweigh the buying pressure. This is a 'sell' signal. If you had purchased TSLA shares when the 50–Day EMA crossed above the 100–Day EMA on October 21st, when the stock was around $253.50, you'd be up 207.9% by now. Not a bad profit for a six–month–hold of a luxury automobile company! Now, as you can see, the 50–Day EMA is still above the 100–Day EMA. That means the bullish trend is still in play! As long as the 50–Day EMA remains above the 100–Day EMA, the stock is more likely to keep trading at new highs in the coming days and weeks. We'll be keeping our eye on this stock as it continues to trend upward. Best Regards, 
Chuck Hughes
Editor, Chart Of The Day | 


没有评论:
发表评论