| Salesforce.com: "Buy Zone" Detected  Dear Chart Of The Day Reader, Dear Chart Of The Day Reader,
Yesterday, we looked at a daily price chart of MarketAxess Holdings Inc. noting the stock’s 50-Day EMA is trading above the 100-Day EMA, signaling a bullish trend. Today’s Chart of the Day is a Keltner Channel Chart for Salesforce.com, Inc. (NYSE: CRM). Salesforce.com is the market and technology leader in on-demand business services. The company's Salesforce suite of on-demand CRM applications allows customers to manage and share all of their sales, support, marketing, and partner information on-demand. The Salesforce Platform – the world's first on-demand platform – enables customers, developers, and partners to build powerful new on-demand applications that extend beyond CRM to deliver the benefits of multi-tenancy and The Business Web across the enterprise. Now, the Keltner Channels serve as an overbought/oversold indicator. When the daily stock price is trading above the Upper Channel, it signals that the stock is overbought. When a stock becomes overbought, it normally declines in price as the inevitable profit taking occurs. As such, stocks in a price uptrend do not advance in a straight line. There are always price retracements along the way. Below is a daily price chart for Salesforce.com, Inc. along with the three Keltner Channels (Upper, Middle, and Lower). 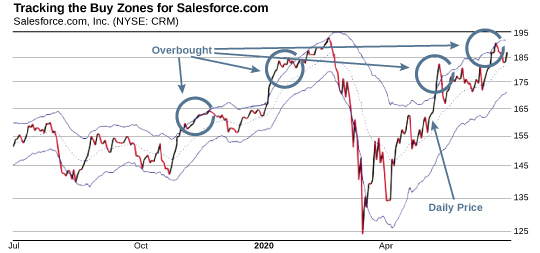 The CRM daily price chart shows that CRM is in a strong price uptrend and recently became overbought many times as the stock traded above the Upper Keltner Channel (circled in blue). As you can see, after trading above the Upper Channel in all scenarios, CRM experienced a pullback. Yet in all cases where CRM experienced the pullbacks, the stock always continued to rally afterwards. If you want to participate in this rally, where is the best place to enter? We use the Keltner Channels to help us select a lower-risk entry point. A Keltner Channel “Buy Zone” occurs when a stock is trading below the Upper Keltner Channel. Once the daily price is trading below the Upper Channel, it signals a buying opportunity. If you had purchased CRM shares when CRM entered the “Buy Zone” around May 14, you’d be up 12.3% on the stock by now. Knowing that CRM shares are continuing to rise, experience pullbacks, and rally again, we’ll be paying attention to future pullbacks in order to get in at the lowest entry point. Best Regards, 
Chuck Hughes
Editor, Chart Of The Day | 


没有评论:
发表评论