| AMD Advances towards 2-Year Trend Mark  Dear Chart Of The Day Reader, Dear Chart Of The Day Reader,
Yesterday, we looked at a Daily Price Chart of Coca Cola Co. and noted that the stock had been making a series of higher highs and higher lows. Today's Chart of the Day is a Daily Price Chart for Advanced Micro Devices, Inc. (NYSE: AMD). Advanced Micro Devices, Inc. operates as a semiconductor company worldwide. The company operates in two segments, Computing and Graphics; and Enterprise, Embedded and Semi-Custom. Now, below is a Daily Price Chart for Advanced Micro Devices, Inc. Back in May 2018, the AMD 1-Month moving-average crossed above the 10-Month simple moving-average (SMA) indicating AMD is on a PowerTrend 'buy' signal (circled). 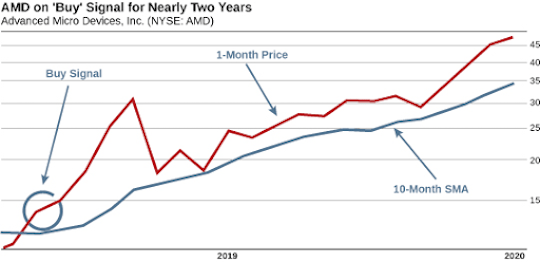
And since then… Prices have continued to climb, never retracing below the 10-Month SMA. If you had purchased AMD shares when the PowerTrend 'buy' signal occurred for the stock back in May 2018, when the stock was around $14.40, you'd be up 230.76% by now. A great profit for simply holding stock shares of a major semiconductor company for less than two years. Now, as you can see, the 1-Month moving-average is still above the 10-month SMA. That means the bullish trend is still in play! As long as the 1-Month Price remains above the 10-month SMA, the stock is more likely to keep trading at new highs in the coming days and weeks. We'll be keeping our eye on this stock as it continues to trend upward so we'll know the moment the market conditions shift and the stock begins to come back down. Maximizing Our Profit Potential Additionally, we'd like to talk about how a previous Chart of the Day stock has done… On December 11th, we highlighted Easterly Government Properties, Inc. (NYSE: DEA), noting that DEA had been making a series of 52-Week Highs. If you happened to have purchased DEA shares on that day, you'd already be up 4.02%. But… if you had purchased the right option contract, you would be up 48.44% in less than two months' time! That's after only one trade. I developed my premium research trading and training service, PowerTrend Options, for the express purpose of finding these life-changing chances. Not by trading with my gut, but trading by the numbers — pure technical analysis. My PowerTrend "X-Ray" system has seen me through more than 30 years of successful trading and competing. It built the life my family gets to live now. In fact, that's the whole thesis of that options research service — the right trade has the power to set you on the path to living the life of your dreams. But we know that some people like to walk before they run… and so we designed a class just for them, called the Thunderbird Options Course. Complete with syllabus, videos, and quizzes. Check it out if you haven't yet! Best Regards, 
Chuck Hughes
Editor, Chart Of The Day | 


没有评论:
发表评论