| Lululemon Stock Responds to Pandemic  Dear Chart Of The Day Reader, Dear Chart Of The Day Reader,
On Friday, we looked at a 12/26 MACD Chart of Fastly, Inc. noting the stock's MACD line was above the 9–Day EMA. Today's Chart of the Day is for Lululemon Athletica Inc. (NYSE: LULU). Lululemon Athletica Inc., together with its subsidiaries, designs, distributes, and retails athletic apparel and accessories for women, men, and female youth. It operates through two segments, Company–Operated Stores and Direct to Consumer. The company offers pants, shorts, tops, and jackets for healthy lifestyle and athletic activities, such as yoga, running, and training, as well as other sweaty pursuits; and athletic wear for female youth. The Daily Price Chart below shows that LULU has traded in a clear bullish pattern of higher highs and higher lows since mid–March. Track the Price Chart from lower left to the upper right... 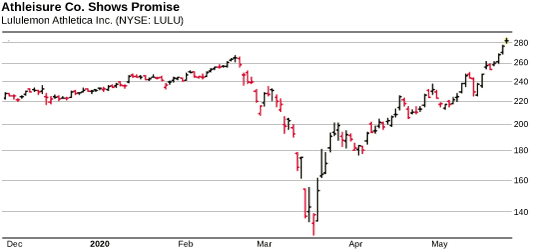 This bullish trading pattern points to a further advance. You see, typically stocks that make a series of two or more higher highs and higher lows reliably continue on in an upward trend. But it's important to note that strong stock rallies have pullbacks along the way. These pullbacks present a buying opportunity for us. Purchasing LULU after a 3 to 5% price pullback has provided a good entry point for the stock during this run, and has produced a healthy return. We'll keep watching LULU as it tops its previous highs and waiting for price pullbacks. Best Regards, 
Chuck Hughes
Editor, Chart Of The Day | 


没有评论:
发表评论