| EVER's Bullish Trend is Still in Play  Dear Chart Of The Day Reader, Dear Chart Of The Day Reader,
Yesterday, we looked at the Daily Price Chart and a MACD Chart for GDS Holdings Ltd. — noting that the stock’s MACD line was showing a ‘buy’ signal. Today’s Chart of the Day is a daily price chart for EverQuote Inc. (NASDAQ: EVER). EverQuote, Inc. operates an online marketplace for insurance shopping in the United States. Its online marketplace offers consumers shopping for auto, home and renters, life, health, and commercial insurance. The company serves carriers, agents, and indirect distributors and aggregators. The company was formerly known as AdHarmonics, Inc., and changed its name to EverQuote, Inc. Now, below is a Daily Price Chart with the 50-Day EMA and 100-Day EMA for EverQuote Inc. Back on May 7, the EVER 50-Day EMA (blue line) crossed above the 100-Day EMA (red line) indicating EVER was showing a ‘buy’ signal (circled). 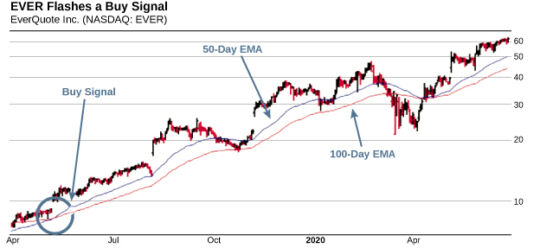
When the 50-Day Exponential Moving Average crosses above the 100-Day Exponential Moving Average, this indicates that the stock’s buying pressure has begun to outweigh the selling pressure signaling a ‘buy’ signal. When the 50-Day EMA crosses below the 100-Day EMA this indicates that the selling pressure has begun to outweigh the buying pressure signaling a ‘sell’ signal. In simpler terms: - 50-Day EMA line Above 100-Day EMA = Buy signal
- 50 Day EMA line Below 100-Day EMA = Sell signal
If you had purchased EVER shares when the 50-Day EMA crossed above the 100-Day EMA on May 7, 2019, when the stock was around $10.70, you’d be up 485.23% by now. Not a bad profit for a little over a yearlong hold of a major insurance marketplace company. Now, as you can see, the 50-Day EMA is still above the 100-Day EMA. That means the bullish trend is still in play! As long as the 50-Day EMA remains above the 100-Day EMA, the stock is more likely to keep trading at new highs in the coming days and weeks. We’ll be keeping our eye on this stock as it continues to trend upward. Best Regards, 
Chuck Hughes
Editor, Chart Of The Day | 


没有评论:
发表评论