| A SKYY-High Buying Opportunity  Dear Chart Of The Day Reader, Dear Chart Of The Day Reader,
On Friday, we looked at a Daily Price Chart of Abbott Laboratories, noting that the stock’s 12/26 Day MACD line is trading above the 9-Day Exponential Moving Average (EMA). Today’s Chart of the Day is a 10-Month Simple Moving Average (SMA) chart for the First Trust Cloud Computing ETF (NASDAQ: SKYY). The SKYY ETF seeks investment results that correspond generally to the price and yield, before the fund's fees and expenses, of an equity index called the ISE Cloud ComputingTM Index. The index is designed to track the performance of companies involved in the cloud computing industry. The fund will normally invest at least 90% of its net assets (including investment borrowings) in the common stocks and depositary receipts that comprise the index. Now, below is a 10-Month SMA chart for SKYY. Back in April, the SKYY 1-Month Price crossed above the 10-Month SMA, indicating SKYY is on a PowerTrend ‘buy’ signal (circled). 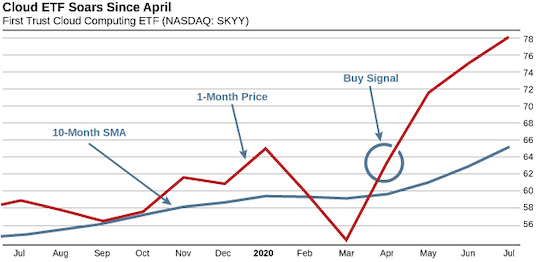 Guess what happened next... Sure enough, prices continued to rise. Since the PowerTrend ‘buy’ signal occurred for the ETF back in April – when the ETF was around $62.55 – the ETF has seen an 24.7% increase. Now, as you can see, the 1-Month Price is still above the 10-Month SMA. That means the bullish trend is still in play! This bullish price trend makes SKYY a good candidate for a call option purchase. As long as the 1-Month Price remains above the 10-Month SMA, the ETF is more likely to keep trading at new highs in the coming days and weeks. We’ll be keeping our eye on this ETF as it continues to trend upward. That way we’ll know the moment the market conditions shift and the ETF begins to come back down, offering a better buying opportunity in a bullish market. Best Regards, 
Chuck Hughes
Editor, Chart Of The Day | 


没有评论:
发表评论