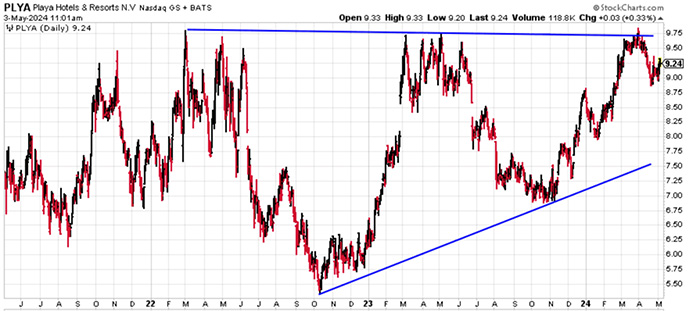
| Early in my career, I was smart enough to know what I didn't know (which was practically everything). So I tried to absorb all that I could from books, classes, websites and people. To find a way to make sense of the market action I observed every day, I set out to learn technical analysis, the study of stock charts. Then I caught a lucky break. I was sitting in my cubicle one day when I got an email from a headhunter about an analyst position. The recruiter told me the job was with Avalon Research Group, which was the most contrarian firm on Wall Street. "You have to get me in the door for an interview," I told her. I knew that learning fundamental research from the company's research director would take my skills to another level. She did end up getting me an interview, and I got the job. After several months of soaking up all the knowledge I could, my research director asked me to create a chart product for our customers, which allowed me to combine my technical and fundamental research skills. Often, technical analysts believe you can tell everything you need to know about a stock by looking at its chart. Fundamental analysts, on the other hand, typically believe charts are voodoo and that everything you need to know about a stock can be found in its financial statements, sector news, valuation, etc. I see the value of both practices, and depending on what kind of action I'm taking, I weigh one more heavily than the other. The Long and Short of It If I'm making a short-term trade, all I care about is the flow of money into and out of the stock, which is what a stock chart shows. The stock's price-to-earnings ratio, profit margins and balance sheet are meaningless (unless there's a catalyst coming up like earnings, in which case traders need to be aware that the catalyst could affect the stock). If there is more buying activity than selling, the chart will reflect that, as the stock's price will rise. If there's more selling activity, it will lead to a lower price for the stock and a downward-pointing chart. Most importantly, I use support and resistance levels - areas where a stock stops going down or up, respectively - to determine my entry and exit points. We don't know why it stops moving at these price levels, and we don't really care. We just know that buying or selling increases at these levels, and we use that to our advantage. Here's an example in the chart of Playa Hotels & Resorts (Nasdaq: PLYA). You can see that the stock's lows are rising and that we can draw a line of support connecting them. This is called an uptrend line. | 


没有评论:
发表评论