| Fresh Bull Trend in Small Cap ETF  Dear Chart Of The Day Reader, Dear Chart Of The Day Reader,
We hope you had a wonderful holiday season, and that you enjoyed our special email series over the last two weeks! Today's Chart of the Day is a Daily Price Chart for Direxion Daily Small Cap Bull 3x Shares (NYSE: TNA). TNA seeks daily investment results of 300% of the daily performance of the Russell 2000 Index, the small cap index. The index measures the performance of approximately 2,000 small-capitalization companies in the Russell 3000 Index, based on a combination of their market capitalization and current index membership. Now, below is a 10-Month Simple Moving Average Chart for Direxion Daily Small Cap Bull 3x Shares. Back in November, the TNA 1-Month moving-average crossed above the 10-Month simple moving-average (SMA) indicating TNA is on a PowerTrend 'buy' signal (circled). 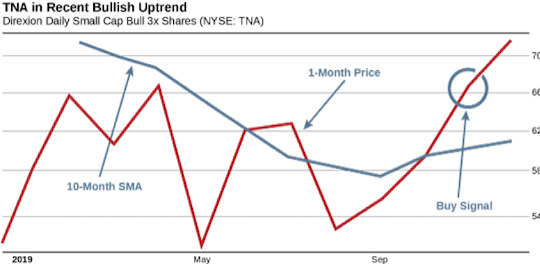 Guess what happened next... Sure enough, prices continued to climb. If you had purchased TNA shares when the PowerTrend 'buy' signal occurred for the stock back in November, when the stock was around $66.74, you'd be up 8.48% by now. Not a bad profit for a less-than-a-month hold of a major market-cap-weighted ETF. Now, as you can see, the 1-Month moving-average is still above the 10-Month SMA. That means the bullish trend is still in play! As long as the 1-Month Price remains above the 10-month SMA, the stock is more likely to keep trading at new highs in the coming days and weeks. We'll be keeping our eye on this stock as it continues to trend upward so we'll know the moment the market conditions shift and the stock begins to come back down. Maximizing Our Profit Potential Additionally, we'd like to talk about how a previous Chart of the Day stock has done… On December 16th, we highlighted iShares U.S. Financials ETF (NYSE: IYF), noting that IYF had retraced into the 'buy zone' after a period of being temporarily overbought. If you happened to have purchased IYF shares on that day, you'd be up 0.97%. But… if you had purchased the right option contract, you would be up 28.57% in less than three weeks' time! That's the power of options. Best Regards, 
Chuck Hughes
Editor, Chart Of The Day | 


没有评论:
发表评论