| Solar Industry Maven Gets Juiced by Buyers  Dear Chart Of The Day Reader, Dear Chart Of The Day Reader,
Yesterday, we looked at a Daily Price Chart of Okta, Inc., noting the stock has been making a series of 52–Week Highs since mid–April. Today's chart is for Enphase Energy Inc. (NYSE: ENPH). Enphase Energy, Inc., together with its subsidiaries, designs, develops, manufactures, and sells home energy solutions for the solar photovoltaic industry in the United States and internationally. The company offers semiconductor–based microinverter, which converts energy at the individual solar module level, and combines with its proprietary networking and software technologies to provide energy monitoring and control services. Now, the Daily Price Chart below shows that ENPH is in a price uptrend because the current price of ENPH is trading higher than it was exactly six months ago. The On Balance Volume (OBV) chart is shown below the Daily Price Chart. Here's what you need to know about the OBV Line: it measures how much volume is either pushing the stock up, or down. Meaning, the volume of stock that's being sold or bought. Using a stock's volume in this way can confirm a downtrend by reflecting that more people are selling the stock than are buying it. Take a look at the chart below… 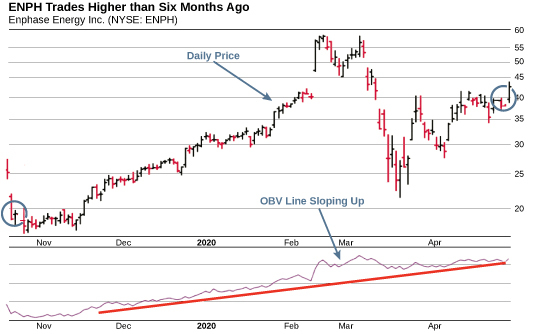 We can see from the OBV chart shown above that the On Balance Volume Line for ENPH is sloping up. This indicates that the volume is heavier on up–days and buying pressure is exceeding selling pressure. Buying pressure must continue to exceed selling pressure in order to sustain a price uptrend. So, the OBV Line is a simple indicator to use that confirms the price uptrend and its sustainability. We'll be sure to keep following Enphase Energy, as the stock's buying pressure exceeds it's selling pressure and the price uptrend continues. Best Regards, 
Chuck Hughes
Editor, Chart Of The Day | 


没有评论:
发表评论